Metastasis map
Every bone lesion, seen with dual-tracer PET at once: ⁶⁸Ga-DOTATOC (somatostatin-receptor density, SSTR) and ¹⁸F-FDG (glycolytic metabolism). A tool for the team to compare the foci, lesion by lesion, as rebiopsy-target candidates — it equips, it does not indicate.
A decision-SUPPORT tool. Not a diagnosis or medical advice.
This is Miriam’s case, opened to understand her disease and to decide better with her medical team — it does not replace their judgment. Her doctors decide.Where the data comes from
This page gathers and visualizes Miriam’s own studies (¹⁸F-FDG PET-CT 24/03/2026, ⁶⁸Ga-DOTATOC PET-CT 26/05/2026 and the cervical and thoracic spine MRI). SUVs are those of the official PET reports; the images (PET and MRI) were reconstructed from the DICOM. The MRI is shown for viewing: its formal reading belongs to the radiologist.
Context · the big picture
Bone disease — the case at a glance
How much disease there is and how it is evolving, before going focus by focus.
Evolution (¹⁸F-FDG)6 foci with rising glycolytic uptake (incl. 2 new), 2 falling, 1 stable — ¹⁸F-FDG only (Jan→Mar 2026). See the trajectory ↓
An orientation to start · where to look
Targets the heuristic lens places best
A heuristic orientation (an indicative estimate, not validated) that EQUIPS the medical team: the foci the lens places best as a target by the imaging signals — tracer uptake (FDG/Ga), tissue yield and size. Tap one to see it in the navigator and in 3D, right below. It helps to weigh; the team decides what to biopsy.
A summary to start; tap a target to open it in the navigator below.
See how it is computed · full listTarget-selection criteria for molecular characterization (and the femoral-neck caveat)
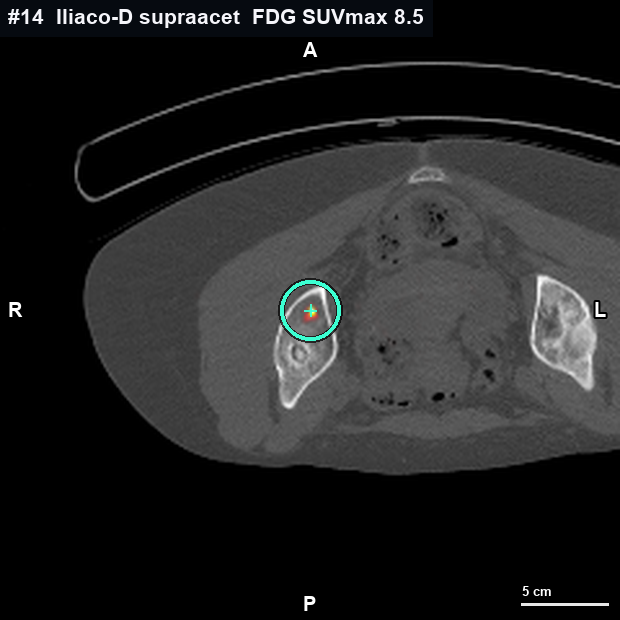
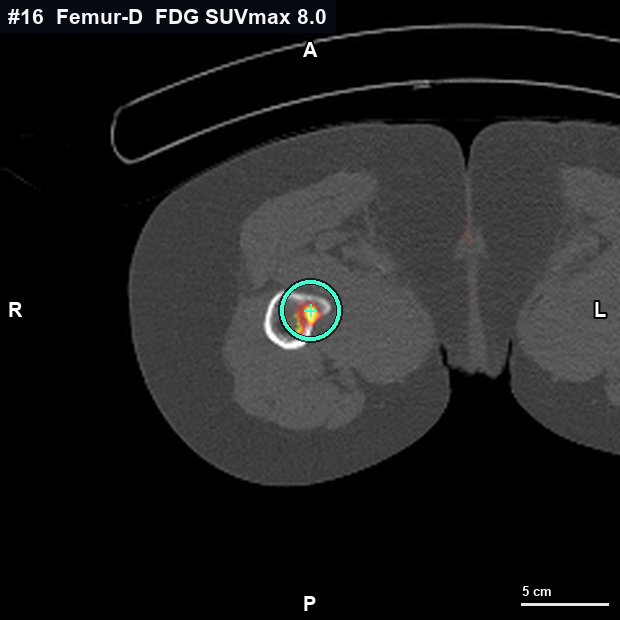
The indicative criterion is not the highest SUVmax, but the subvolume most likely to provide representative viable tumor cellularity — with RNA integrity sufficient (DV200) for WES + RNA-seq — via a CT-guided percutaneous approach of acceptable risk. Under this heuristic criterion (an indicative estimate, not validated), the team could weigh the supra-acetabular iliac (#14): rising ¹⁸F-FDG, non-sclerotic CT attenuation and an accessible posterolateral corridor; and, depending on the clone to be characterized, also the L1 pedicle (#10), discordant ¹⁸F-FDG⁺ / ⁶⁸Ga-DOTATOC⁻. The femoral neck (#16) has the highest ¹⁸F-FDG and may be of biological interest, but lies in weight-bearing bone: core sampling carries pathologic-fracture risk, whose indication is assessed by Radiation Oncology/Orthopedics; documented as a consideration, not an exclusion. L5 (#11) is on concurrent SBRT: irradiated tissue may not be representative. This orients, it does not decide: final target selection rests with the tumor board; quantification caveats in “Sources, method and caveats”.
Navigate the foci · see them in 3D
The map, lesion by lesion
Pick a focus —on the skeleton or in the table— and, without moving, the summary and the 3D bone update instantly. Colour runs along the discordance axis, from violet (SSTR-dominant, ⁶⁸Ga⁺/FDG⁻) to coral (glycolytic-dominant, FDG⁺/SSTR⁻); the number is the focus id. The skeleton is a schematic guide; the table, a compact, sortable list.
Front view · the body’s right is on your left
Color = tracer · badge = nº of foci in that vertebra · dashed outline = AI-detected (to confirm).
Controls
Filter map foci
How to read this timeline
Compares FDG only (Jan→Mar 2026). The May step is the ⁶⁸Ga-DOTATOC, a single study (26 May): not comparable over time.
vertebral body
#72 fociThoracolumbar junction · midline
Area with 2 foci · summary of the main one
⁶⁸Ga-DOTATOC SUVmax 13.27 (very intense SSTR) / ¹⁸F-FDG 7.61 (prior 10.19, ↓). Mixed, SSTR-predominant (SSTR>FDG). Blastic.
indicative · viable × yield × size.
SSTR · ⁶⁸Ga
13.27SUVmax
Glycolysis · FDG
7.61SUVmax(-2.6)
Shape (CT)
blastic (dense bone)
Metabolic extent
26.9 mm · 3.31 ml
Bone reconstructed from the CT · co-registered uptake
This area has 2 co-localized foci (SSTR/glycolytic uptake); the highlight marks the area. Each focus is detailed below and in the table.
The per-vertex colour is a projection of the PET onto the mesh (it shows where, not SUVmax); ¹⁸F-FDG and ⁶⁸Ga-DOTATOC are from different dates co-registered onto the CT (approximate localization by co-registration). Method and caveats ↓
See these values in text, in the table ↓ — the viewer’s textual alternative (all foci and their figures).
Full focus detail #7
The 3 readings, bone shape, extent and quantification
ExpandCollapse
Full focus detail #7
The 3 readings, bone shape, extent and quantification
This area hosts 2 foci · shown as a single bone
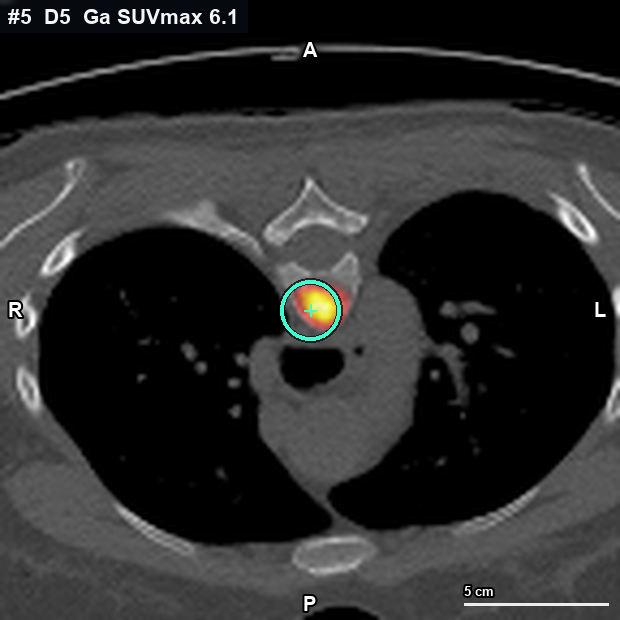
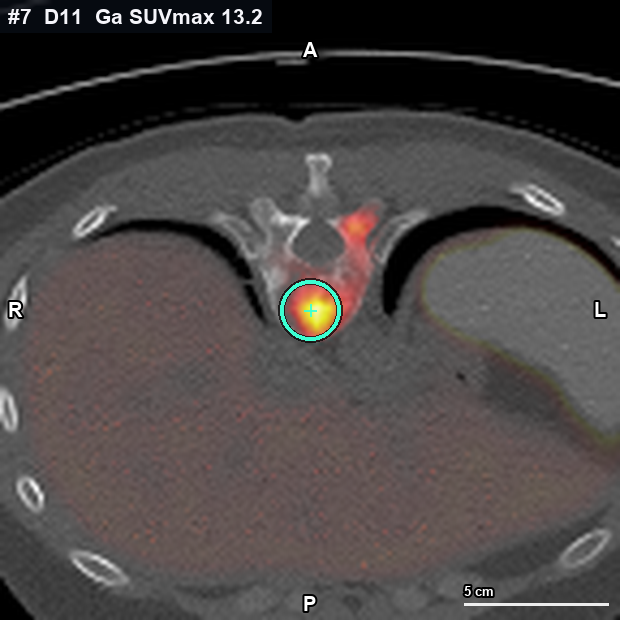
- #7vertebral body·SSTR · ⁶⁸Ga 13.27glycolysis · FDG 7.61
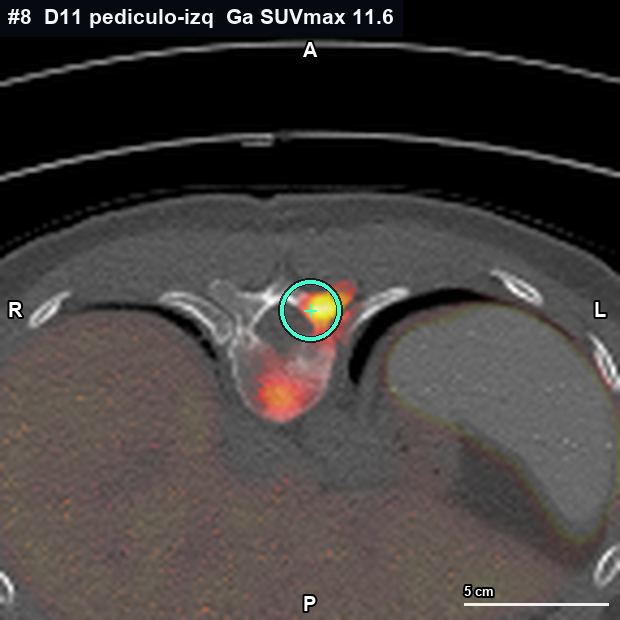
- #8left pedicle·SSTR · ⁶⁸Ga 11.63glycolysis · FDG —
The expanded detail below is for the area’s main focus; the rest is in the table.
The three readings · one per test
Three tests look at the same focus. Labelled by the test, not the biology.
SSTR · ⁶⁸Ga-DOTATOC
somatostatin-receptor density
13.27
SSTR SUVmax
Glycolysis · ¹⁸F-FDG
glycolytic metabolism (labelled glucose)
7.61(-2.6)
SUVmax · Δ vs prior
MRI · shape
morphology — a shape channel, not a 3rd color
Blastic lesion. The MRI describes anterior epidural extension and left lateral canal compromise at D11.
Provenance · where each figure comes from field by field
Each figure for this focus with its origin: source, study date, tracer, whether it is MEASURED or INTERPRETED, and its reference. It is the same source as the downloadable manifest (CSV/JSON) — what you see here is what you download.
⁶⁸Ga-DOTATOC SUVmax13.3SUVmáx
official reportmeasured· 68Ga-DOTATOC· 26 May 2026
¹⁸F-FDG SUVmax7.6SUVmáx
official reportmeasured· 18F-FDG· 24 Mar 2026
Prior ¹⁸F-FDG SUVmax10.2SUVmáx
official reportmeasured· 18F-FDG· Jan 2026
Metabolic extent (mm)27mm
DICOM measurementmeasured· 24 Mar 2026
MTV (ml)3.3ml
DICOM measurementmeasured· 24 Mar 2026
Morphology (bone shape)blástica
official reportinterpreted· 24 Mar 2026
Soft tissue / extraosseous extensionsí
MRI (verbatim)interpreted· 11 Jun 2026
Phenotype (SSTR ↔ glycolysis axis)Dual · predominio SSTR
derived (heuristic)interpreted
Suitability as a target (score)240-100
derived (heuristic)interpreted· heuristic · not validated
Provenance markers
- official reportmeasured
- DICOM measurementmeasured
- MRI (verbatim)interpreted
- derived (heuristic)interpreted
- approximate (AI · to confirm)interpreted
Filled = MEASURED (physical quantity: SUVmax, mm, ml). Open or “~” = INTERPRETED or approximate (reading/rule).
Anti-PHI: synthetic ids #1–19 only; any reference to a DICOM slice is an index/code, with no patient metadata.
Bone shape and tumor amount morphology · CT
Morphology (shape)
blastic (dense bone)
Blastic / sclerotic = dense bone; usually yields less tumor tissue.
Metabolic extent (mm) · MTV (ml)
26.9 mm · 3.31 ml
what it takes up above the threshold (41% of local SUVmax), confined to bone — not the exact anatomical size.
MTV by tracer
FDG 14.24 ml
metabolic volume per tracer (verification, indicative)
Soft tissue / extraosseous extension feasibility · MRI
The MRI describes a soft-tissue / extraosseous component (anterior epidural space, left lateral canal). Soft tissue usually yields more than dense blastic bone, but given its proximity to the canal and nerve roots, accessibility and safety are assessed by interventional radiology.
Suggested puncture approach · safety equips, does not indicate
- Zone:
- The epidural soft-tissue component would offer the highest tissue yield — not the intra-osseous sclerotic core.
- Approach:
- The highest-yield tissue is epidural/intracanal.
- Safety:
- Contiguous to the spinal cord and roots: interventional radiology flags D11 (T11) as a level to avoid given the anterior epidural extension.
- Yield (indicative heuristic estimate, not validated):
- High if the soft-tissue component were accessible; access is vetoed on safety grounds.
Access and anatomy from the case itself, for interventional radiology and the tumor board to decide on live imaging.
What this focus shows
- Intense receptor (SSTR) uptake.
- High glycolytic (¹⁸F-FDG) uptake.
- FDG lower than in the prior study (was 10.19).
- Blastic morphology (dense bone).
Derived from the focus’s own SUVs, trend and morphology.
Measured from the DICOM (automatic verification)
Automatic SUV versus table automatic · verification
¹⁸F-FDG · glycolysis
⁶⁸Ga-DOTATOC · SSTR
SUV recomputed from the DICOM (decay-corrected), MTV and TLG with a CT bone mask; morphology from CT density. ¹⁸F-FDG (1.65 mm) has higher spatial resolution than ⁶⁸Ga-DOTATOC (4 mm). Verification: the table prevails.
Technical detail (for the medical team)
13.27
7.61
↓ fell (was 10.19)
blastic / sclerotic
General section
Case overview
The general view of the case, from most to least relevant for deciding: suitability (how it is computed), phenotype, imaging, evolution, the table and the case overview. Use the index to navigate it.
The lens · choosing where to rebiopsy
Suitability as a biopsy target
How to read this lens equips, does not indicate
An OPT-IN lens (an indicative heuristic estimate, not validated): when you turn it on, it orders the foci by the signals that matter to weigh where to rebiopsy — tracer uptake (¹⁸F-FDG / ⁶⁸Ga-DOTATOC), tissue yield by morphology (lytic / soft tissue yields more; dense blastic, little) and size. By default, the list goes by anatomical level (a neutral fact). Accessibility and safety are assessed by interventional radiology. It offers, it does not decide.
The full calculation: suitability is the product of three visible factors, plus three FEASIBILITY flags the team weighs (not part of the number). The summary with the targets the lens places best is at the top, in “Targets the heuristic lens places best”.
1 · Uptake (¹⁸F-FDG / ⁶⁸Ga)
¹⁸F-FDG SUVmax: the higher the glycolytic uptake, the more viable metabolic signal to sample; ⁶⁸Ga-DOTATOC adds the somatostatin-receptor (SSTR) density.
2 · Yield (heuristic estimate)
Bone shape: lytic / soft tissue usually yields more tissue; dense blastic yields little (as the 26B585 iliac biopsy failed). It is SHAPE, not biology.
3 · Size / amount
Lesion major axis (larger = easier and more tissue) and, where measured, the MTV (metabolic tumor volume).
Flag · prior history 26B585lesson
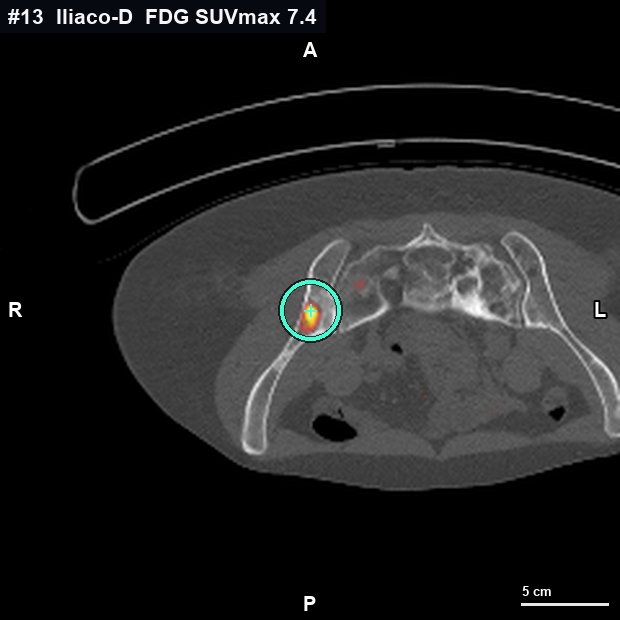
The prior 26B585 biopsy (right iliac, #13) FAILED: only bone and muscle, no evaluable tumor. The lesson: the sampled zone was dense (blastic) bone, which yields little — that is why yield (shape) weighs in the lens: lytic / soft-tissue tissue usually yields more evaluable tumor than dense bone. Shown as a flag; not part of the number.
Flag · soft tissue (MRI)feasibility
Where the MRI describes soft tissue / extraosseous extension (e.g. D11 epidural, #7), there is a soft-tissue target that usually yields more than dense blastic bone; proximity to the canal/roots is assessed by interventional radiology. Not part of the number.
Flag · accessibility
Accessibility and safety are not available to us as a reliable datum: interventional radiology assesses them. They are neither invented nor scored.
The formula
idoneidad = 100 · viable · rendimiento · tamaño
viable = 0.78·(FDG/10) + 0.22·(Ga/14) · yield = lytic 1 / mixed 0.6 / blastic 0.3 · size = 0.6–1 by the major axis of the measured metabolic extent. Indicative.
The weights of the three factors (default 1) are a hand-set CRITERION: move them in the stress-test below and you will see the order change → it is not a measured truth, it is an orientation.
Metabolic extent = what each focus takes up above the threshold (41% of the local SUVmax), confined to bone, measured on the DICOM. It is what imaging shows, not the exact anatomical size; partial-volume effect underestimates foci < ~10 mm.
Report foci, by anatomical level
tap a focus to open its cardStress-test: move the weights heuristic, not validated
Move the weights of the three factors: the order of the foci changes before your eyes. That is what it demonstrates: the score is an indicative HEURISTIC with hand-set criteria, not a measured truth. It is not “tune it until it says what you want” — it is seeing that the order depends on a criterion. The team decides.
Turn on “Sort by suitability” above to see the list reorder live as you move a weight. Weight 0 = that factor is ignored; weight 1 = as it is today; weight 2 = it weighs double.
Reminder: this is an INDICATIVE ORDER by imaging signals, not an instruction on what to biopsy. The decision — including accessibility and safety — belongs to the medical team with interventional radiology.
AI-detected · outside the order unconfirmed
These foci were detected by an AI on the DICOM and are not in the official report. Candidates yes, real weight no: they require imaging correlation with Nuclear Medicine before being considered a target. That is why they stay outside the order above.
The same selection, by type
Phenotype map — the third linked view
Each lesion placed by both tracers at once: the horizontal axis is glycolytic uptake (¹⁸F-FDG SUVmax) and the vertical the somatostatin-receptor density (⁶⁸Ga-DOTATOC SUVmax). Each quadrant is labelled on the chart itself. Tap a dot to open its card; the dividers are indicative.
split disc = left half ⁶⁸Ga-DOTATOC (teal) · right half ¹⁸F-FDG (amber); more intense = higher SUVmax. The asymmetry is the discordance.
dashed outline = AI-detected, to confirm (#17/#18/#19)
SUVmax from the reports. Colour encodes the TRACER, not biology or prognosis.
The real imaging
The real imaging, reconstructed from the DICOM
Reconstructed from the DICOM. The valuable bits at a glance: whole body (MIP) and the spine on PET, with both tracers. Tap any to open it large and browse them all with the arrows. The MRI is below.
Qualitative MIP (SUVmax is in the table and card). The most intense areas are physiological biodistribution: on ¹⁸F-FDG (24/03/2026), brain, myocardium (variable), excretory system and bladder; on ⁶⁸Ga-DOTATOC (26/05/2026), pituitary, spleen, liver, kidneys, adrenals and bladder. The metastases are the skeletal foci.
The spine on MRI
The MRI shows bone and bone marrow in more detail than the PET-CT. Slide to scroll through the slices.
Report findings · cited
What the spine MRI says (11 Jun 2026)
Text transcribed from the MRI report, captured in the supportive document (12 Jun 2026). It is the report’s text, not a re-reading of the image by this tool.
Levels with metastasis (multilevel):
- D11 — anterior epidural extension and left lateral canal compromise.
- Chronic pathological fractures (since 2024) of L1 and L3.
- Spinal cord with normal signal.
MRI and biopsy feasibility: the D11 epidural component is a soft-tissue target that usually yields more than dense bone; its proximity to the canal and roots is assessed by interventional radiology. It feeds the lens’s feasibility flags.
One per focus · all in a row
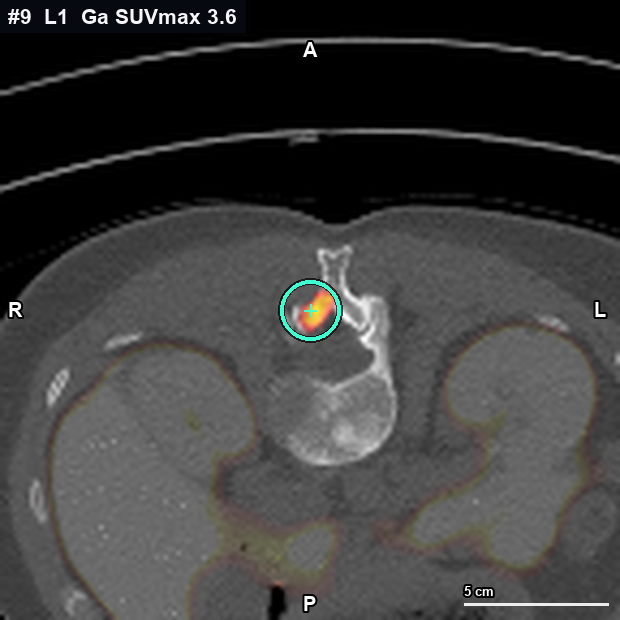
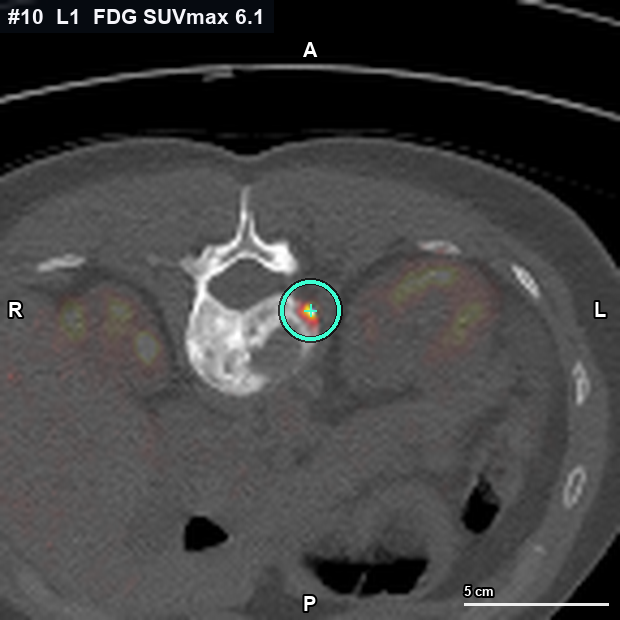
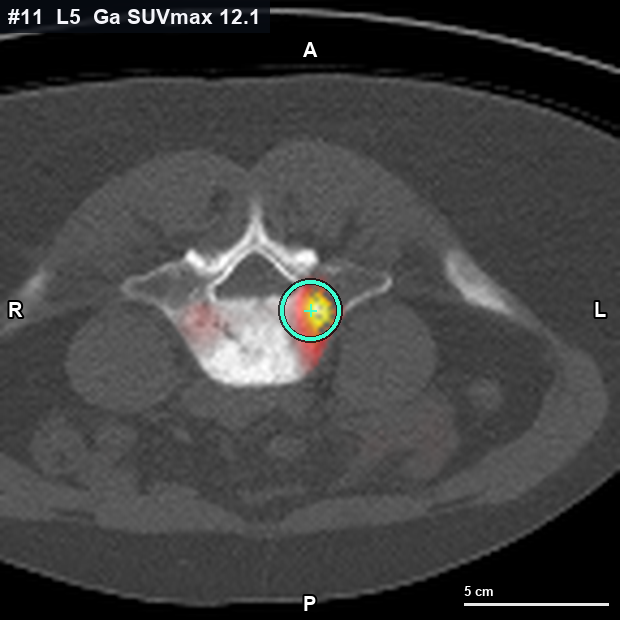
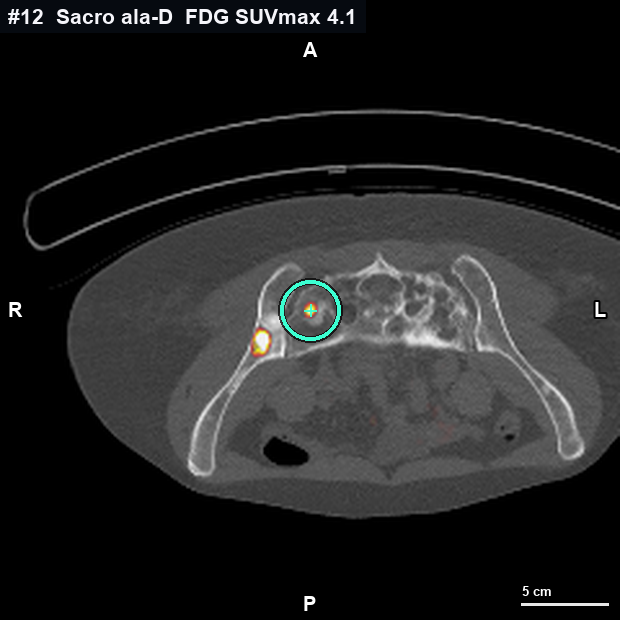
Key images per focus · PET-CT
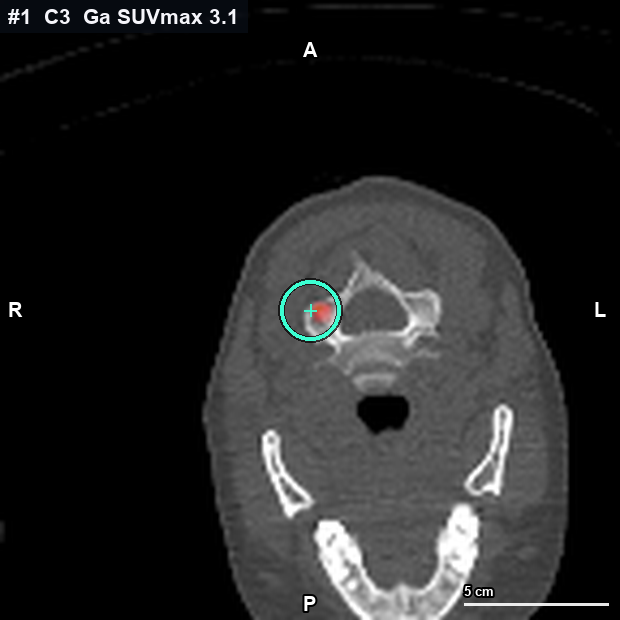
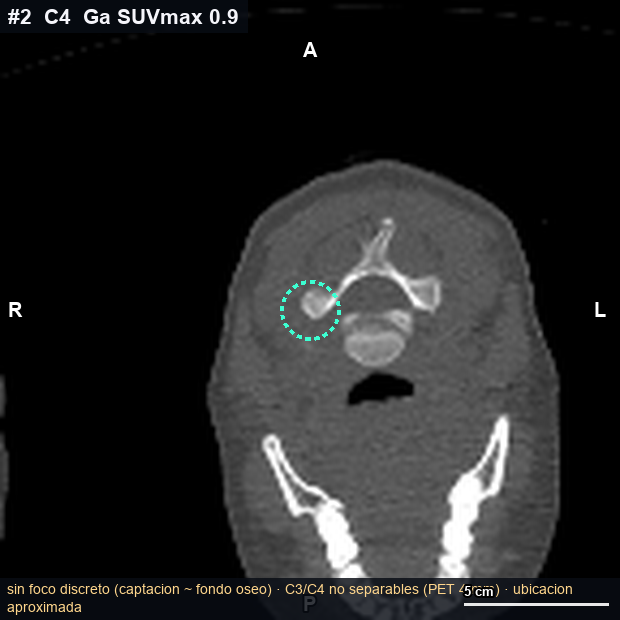
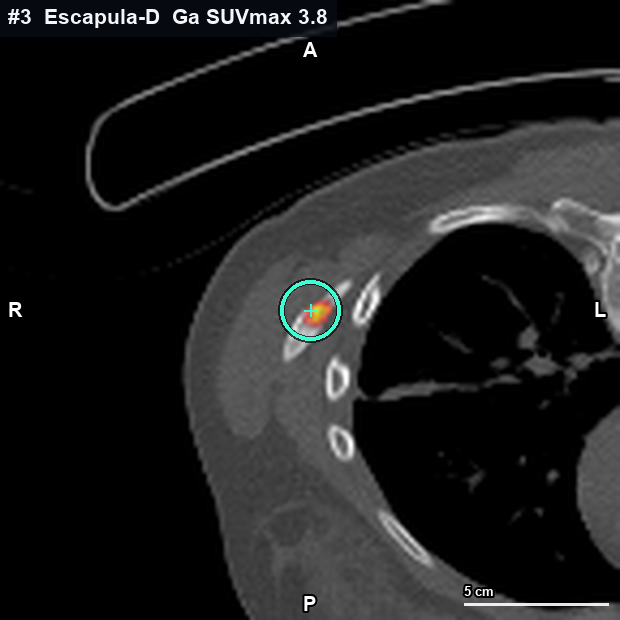
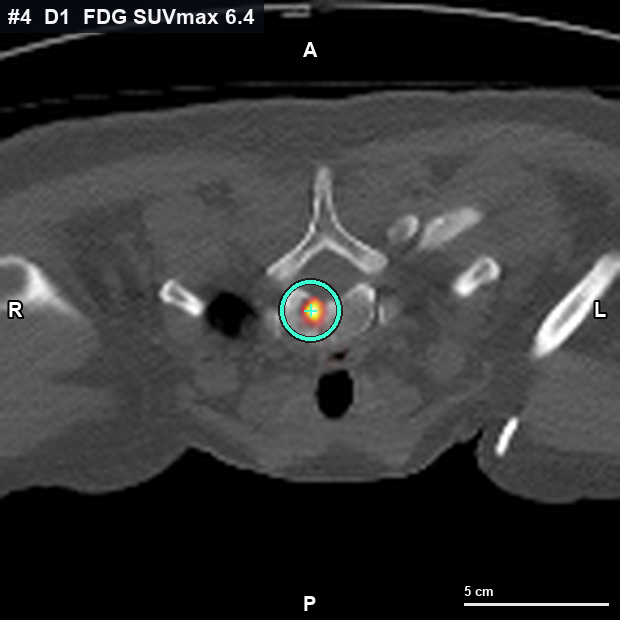
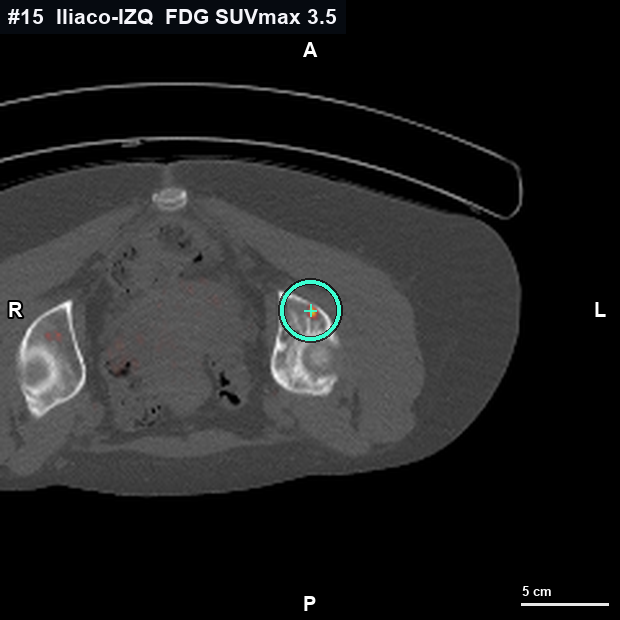
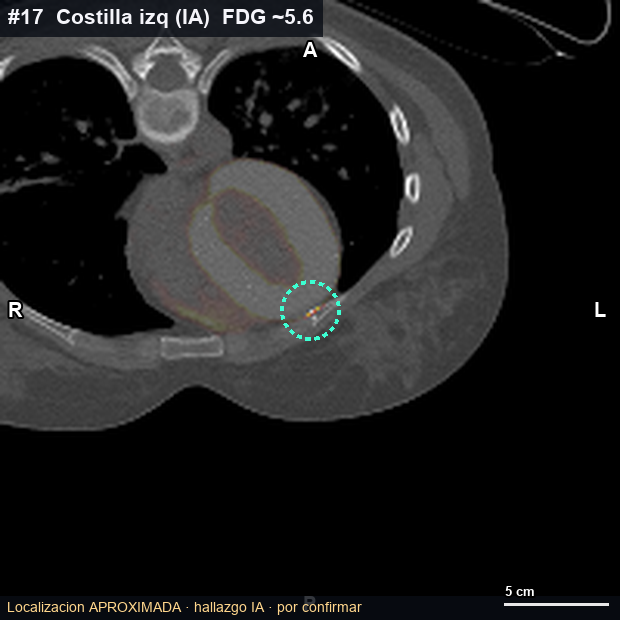
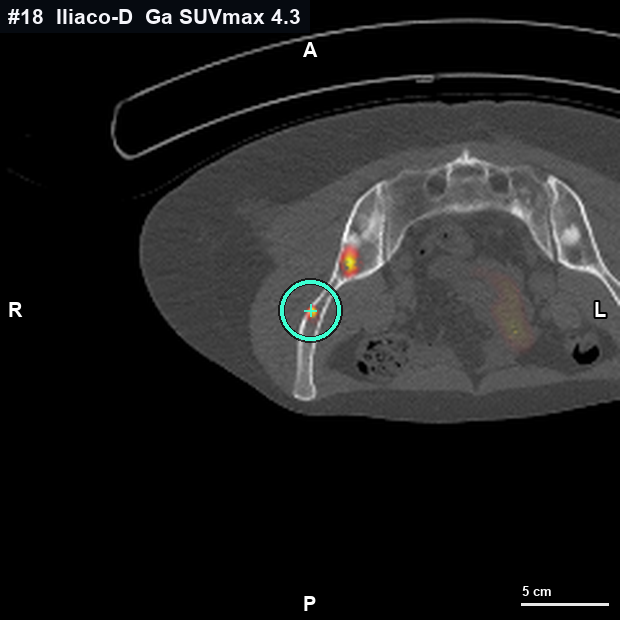
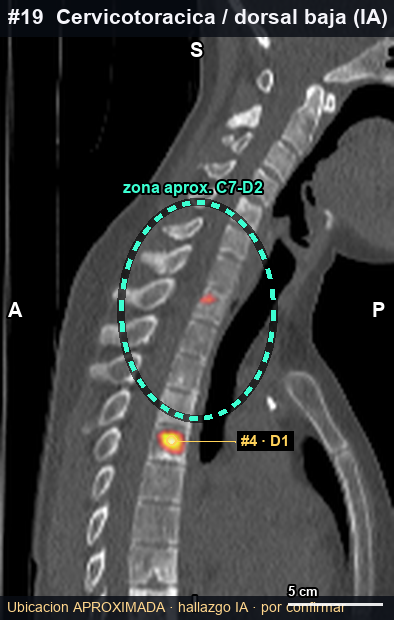
Each confirmed focus, with its axial PET-CT slice and the SUVmax ring. Tap any to open it large (zoom, drag and the planes it has: sagittal or coronal). AI-detected foci are at the end, to confirm.
Images reconstructed from the PET-CT; the ring marks the SUVmax (a single voxel), approximate due to resolution/co-registration; it does not replace the formal reading.
What has changed
Trajectory since the prior study
Glycolytic-uptake (¹⁸F-FDG) comparison between the prior study (Jan 2026) and the current one (Mar 2026), over the 9 foci with a prior value. The ⁶⁸Ga-DOTATOC (SSTR) is from the May 2026 study, with no prior to compare.
For the team · reference
Appendix: the foci in a table
Full table with suitability as a target (an indicative heuristic estimate, not validated), SUVmax per tracer, trend, measured metabolic extent and pattern, plus the automatically detected extra foci. It defaults to id order (anatomical level, a neutral fact); click a header to re-sort — including the suitability one. AI-detected foci always go last, in their own group, unconfirmed.
This table is the textual alternative to the 3D viewer and the skeleton schematic: the same per-focus figures, in text and navigable. The row of the focus you have selected above is highlighted here.
Data manifest · downloadable validated
The 19 foci with their values and field-by-field PROVENANCE: where each figure comes from (report · DICOM measurement · MRI verbatim · derived · AI-approximate) and whether it is MEASURED (SUVmax, mm, ml) or INTERPRETED (morphology, phenotype, score). The JSON includes the schema (the clonable contract). Synthetic ids #1–19 only, no patient data.
Validation: the manifest derives from the same values as the table and reproduces, by construction, every SUVmax and score shown above (verified at build). It does not recompute precision: it separates measured from interpreted.
Provenance markers
- official reportmeasured
- DICOM measurementmeasured
- MRI (verbatim)interpreted
- derived (heuristic)interpreted
- approximate (AI · to confirm)interpreted
Filled = MEASURED (physical quantity: SUVmax, mm, ml). Open or “~” = INTERPRETED or approximate (reading/rule).
Open the table and extra foci
Click a header to sort. Report foci come first and, at the end, in their own group, the AI-detected ones (approximate DICOM measurements, to confirm with Nuclear Medicine). The metabolic extent is what each focus takes up above the threshold (41% of the local SUVmax), confined to bone; it is not the exact anatomical size and partial volume underestimates foci < ~10 mm.
| 1 | C3 · spinous process | Mid | 2 | 2.9 | — | — | — | 15.1 mm · 1.17 ml | SSTR-dominant (⁶⁸Ga⁺ / FDG⁻) |
|---|---|---|---|---|---|---|---|---|---|
| 2 | C4 · right lamina / arch | R | 2 | 3.1 | — | — | — | — · not reliable | SSTR-dominant (⁶⁸Ga⁺ / FDG⁻) |
| 3 | Right scapula | R | 2 | 3.8 | — | — | — | 35.0 mm · 2.62 ml | SSTR-dominant (⁶⁸Ga⁺ / FDG⁻) |
| 4 | T1 · vertebral body | Mid | 13 | 4.2 | 7.0 | 2.8 | +4.2 | 10.5 mm · 0.50 ml | Dual · glycolytic-predominant |
| 5 | T5 · vertebral body | Mid | 3 | 6.2 | — | — | — | 22.8 mm · 3.59 ml | SSTR-dominant (⁶⁸Ga⁺ / FDG⁻) |
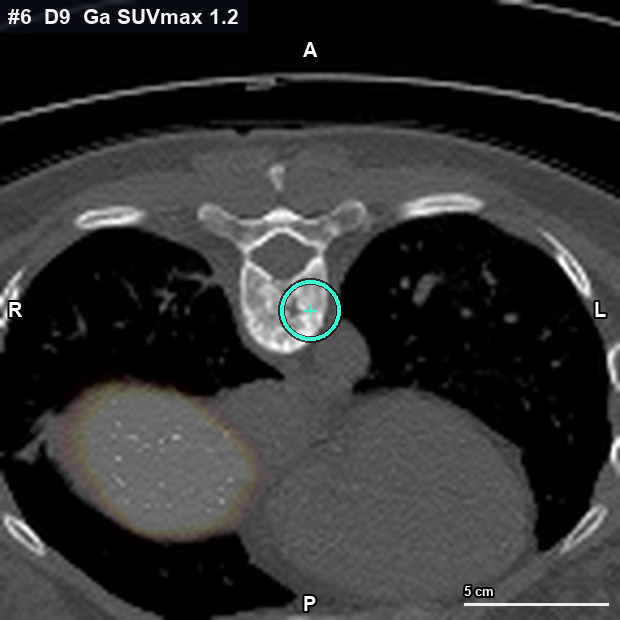
| 6 | T9 · right body | R | 1 | 1.4 | — | — | — | — · not reliable | SSTR-dominant (⁶⁸Ga⁺ / FDG⁻) |
| 7 | T11 · vertebral body | Mid | 24 + soft tissue | 13.3 | 7.6 | 10.2 | -2.6 | 26.9 mm · 3.31 ml | Dual · SSTR-predominant |
| 8 | T11 · left pedicle | L | 9 | 11.6 | — | — | — | 25.1 mm · 2.73 ml | SSTR-dominant (⁶⁸Ga⁺ / FDG⁻) |
| 9 | L1 · spinous process | Mid | 2 | 3.7 | — | — | — | 22.1 mm · 2.04 ml | SSTR-dominant (⁶⁸Ga⁺ / FDG⁻) |
| 10 | L1 · left pedicle | L | 16 | — | 6.8 | 4.7 | +2.2 | 21.3 mm · 0.73 ml | Glycolytic-dominant (FDG⁺ / SSTR⁻) |
| 11 | L5 · vertebral body | Mid | 7 | 12.1 | 5.0 | 4.8 | +0.2 | 28.0 mm · 2.64 ml | Dual · SSTR-predominant |
| 12 | Right sacral ala | R | 20 | 4.3 | 4.3 | 6.3 | -1.9 | 18.1 mm · 0.98 ml | Dual · balanced |
| 13 | Right iliac · iliac wing | R | 40 ⚑ 26B585 failed | 4.3 | 7.7 | 7.0 | +0.7 | 21.3 mm · 2.25 ml | Dual · glycolytic-predominant |
| 14 | Right supra-acetabular iliac | R | 27 | 4.0 | 9.3 | 4.0 | +5.3 | 10.1 mm · 0.32 ml | Dual · glycolytic-predominant |
| 15 | Left supra-acetabular iliac | L | 9 | 2.5 | 4.0 | 1.9 | +2.0 | 13.7 mm · 0.62 ml | Dual · glycolytic-predominant |
| 16 | Right proximal femur | R | 49 | 5.1 | 9.4 | 6.0 | +3.4 | 32.6 mm · 3.49 ml | Dual · glycolytic-predominant |
| AI-detected · possible new foci · to confirm | |||||||||
| 17 | Upper thorax / rib | Mid | 12 unconfirmed | ~1.6 | ~4.8 | — | — | — · to confirm | Dual · glycolytic-predominant |
| 18 | Right iliac · iliac-femoral junction | R | 6 unconfirmed | ~4.3 | ~1.7 | — | — | 16.2 mm · 1.04 ml | Dual · SSTR-predominant |
| 19 | C7–D2 · cervicothoracic junction | Mid | 10 unconfirmed | ~4.2 | ~3.1 | — | — | — · to confirm | Dual · SSTR-predominant |
The data in this panel come from a quantitative re-reading of the native DICOM (validated): it is an assisted measurement, it does not replace the formal Nuclear Medicine reading. These genuine uncertainties remain:
- The metabolic extent of #2 (C4) and #6 (D9) is not reliable: their uptake is ≈ bone background and cannot be separated from normal bone.
- AI-detected foci #17 (rib), #18 (iliac-femoral) and #19 (cervicothoracic) are not in the official report — to review with Nuclear Medicine (#17 and #19 also with unreliable / non-measurable values).
Extra foci detected (automatic, not in the table) verification
FDG foci the automatic detection found on the DICOM that are NOT in the table. Not a diagnosis: for the team to decide whether to add any. The first (HU 1) is likely soft-tissue uptake; the blastic SUVmax 5.82 (HU 704, left) is the most suggestive of a real unlisted lesion.
Reference · how to read it and the breakdown
How to read it · case breakdown
the two-tracer coding and concordance · no interpretation
See the breakdown: concordance, trajectory, how to read it and summary for the team
SSTR ↔ glycolysis concordance
Glycolytic uptake (¹⁸F-FDG) vs prior study
over 9 foci with a value in the prior PET (Jan 2026)
Summary for the medical team
Multilevel bone disease. 16 foci in the official report (11 axial — spine and sacrum — and 5 appendicular — scapula, pelvis and hip), plus 3 foci to confirm detected by AI. SSTR↔glycolysis split: 7 SSTR-dominant (⁶⁸Ga⁺/FDG⁻), 8 with dual uptake (both tracers) and 1 glycolytic-dominant (⁶⁸Ga⁻/FDG⁺). SUVmax range: ⁶⁸Ga-DOTATOC 1.4–13.3; ¹⁸F-FDG 4.0–9.4. Versus the prior PET (over 9 foci with a prior value): 2 new, 4 with higher ¹⁸F-FDG, 2 with lower and 1 stable. Figures are those of the official PET reports; the per-focus detail is in the card and the table.
How to read it · one lesion, two tracers
Each bone focus is studied with two PET tracers, each sensitive to a different property of the same spot: ⁶⁸Ga-DOTATOC measures somatostatin-receptor (SSTR) density and ¹⁸F-FDG measures glycolytic metabolism. Comparing the two uptakes defines each lesion’s tracer-discordance pattern.
The SSTR ↔ glycolysis bar
On every card and row, the violet↔coral share sums up the focus’s SSTR versus glycolytic uptake. Color runs along the discordance axis, from violet (SSTR-dominant) to coral (glycolytic-dominant).
⁶⁸Ga⁺ / FDG⁻
SSTR uptake with absent or minimal glycolysis.
Dual uptake (both)
Takes up both tracers: SSTR and glycolysis at once.
FDG⁺ / ⁶⁸Ga⁻
Glycolysis without detectable SSTR: tracer discordance.
Sources, method and caveats
Sources. SUV and locations: ¹⁸F-FDG PET-CT report 24/03/2026 and ⁶⁸Ga-DOTATOC PET-CT report 26/05/2026 (Nuclear Medicine, Virgen de la Arrixaca Hospital). PET images: MIP, sagittal fusion and axial slices reconstructed from the DICOM (attenuation-corrected PET + CT). MRI: sagittal cervical and thoracic spine slices (STIR and T1) exported from the DICOM; visualization only, pending formal radiology reading. SUVs recomputed from the DICOM agree with the report within ~10–12% (expected voxel-max ↔ ROI difference).
What each reading measures. ⁶⁸Ga-DOTATOC (SSTR) = somatostatin-receptor density; ¹⁸F-FDG = glycolytic metabolism; “blastic/lytic/mixed” = bone SHAPE by CT density, not biology or a third tracer. The metabolic extent is what is taken up above the threshold (41% of the local SUVmax), confined to bone, not the exact anatomical size.
Quantification caveats (apply to the WHOLE page). SUVmax is a single-voxel value subject to partial-volume effect (underestimates foci < ~10 mm). The two PET studies are not simultaneous (FDG 24/03, ⁶⁸Ga 26/05). Both tracers were given via a port (port-a-cath): possible residual activity would underestimate SUVs globally (not recalculable; does not affect relative comparisons). Physiologic uptake or artifact may occur. The page DESCRIBES imaging findings; it does not conclude and is not medical advice — formal reading and final target selection rest with the radiologist and the tumor board.
The four method caveats (key to reading the page). (1) The suitability score is HEURISTIC, with hand-set weights and NOT validated against biopsy outcomes: it orients, it is not a measured probability. (2) Inter-study comparison (e.g. current vs. prior ¹⁸F-FDG) is only valid with the same tracer, scanner and reconstruction; SUVs are not subtracted across different tracers (⁶⁸Ga vs. ¹⁸F-FDG). (3) The per-vertex values of the 3D model are a PROJECTION of the PET onto the mesh, not a quantified SUVmax: they show where, not how much. (4) Spatial co-registration: ¹⁸F-FDG (24/03/2026) and ⁶⁸Ga-DOTATOC (26/05/2026) are studies from DIFFERENT dates co-registered onto the CT mesh; the overlay carries an error of several millimeters (approximate localization by co-registration), not an exact fusion.
Method · reproducible
How this is built (and how to clone it)
the pipeline + the schema, published as a contract
What makes this page reusable is not the 3D viewer: it is that the data METHOD and SCHEMA are published as a contract that another N-of-1 case fills in with THEIRS. Below: the pipeline step by step, the open-source tools involved, their limits, and the downloadable schema.
Open the full method (pipeline · schema-contract · fork this · principles)
1 · The pipeline, step by step
From two PET-CT studies with different tracers to a navigable instrument. Each step declares which open-source tool is involved and where its limit lies.
- 1
Input · dual-tracer PET-CT
Two PET-CT studies of the same patient: ⁶⁸Ga-DOTATOC (somatostatin receptors, SSTR) and ¹⁸F-FDG (glycolysis), with their Nuclear Medicine reports. What ENTERS: the DICOM series (attenuation-corrected PET + CT) and the report text.
- 2
Co-registration onto the CT mesh
The two studies are brought into a common spatial frame: the CT mesh. Declared caveat: they are from DIFFERENT dates (¹⁸F-FDG 24/03/2026, ⁶⁸Ga-DOTATOC 26/05/2026), so the overlay is an approximate localization by co-registration, with an error of several millimeters, not an exact fusion.
- 3
Discordance axis · SSTR ↔ glycolysis
Per focus, each tracer’s uptake (SUVmax) is compared and the lesion is placed on the SSTR-dominant (⁶⁸Ga⁺/FDG⁻) ↔ glycolytic-dominant (⁶⁸Ga⁻/FDG⁺) axis. SUVs are NOT subtracted across different tracers: the axis is qualitative, it describes the pattern.
- 4
Suitability · declared heuristic
A 0–100 score of suitability as a biopsy target, with hand-set weights and NOT validated against biopsy outcomes. It orients, it is not a measured probability: offered as an opt-in lens, never as the default order or a verdict.
- 5
3D viewer · bone masks + PET projection
Bone segmentation from the CT is obtained with TotalSegmentator (open-source). The PET is projected per-vertex onto that mesh to localize each focus. Caveat: the per-vertex colour is a PROJECTION — it shows where, not a quantified SUVmax (≠ SUVmax).
Open-source tools · and what is in-house measurement
- · TotalSegmentator — automatic bone segmentation from the CT (open-source, publicly reproducible on any CT).
- · PET → mesh reconstruction / projection — the (attenuation-corrected) PET is projected onto the CT mesh to place the foci (in-house pipeline over the DICOM).
- · SUVmax re-quantification over the native DICOM — IN-HOUSE MEASUREMENT (David) that verifies the report; agrees within ~10–12% (voxel-max ↔ ROI). It is not the public pipeline.
The limits (honest)
The per-vertex projection is NOT a quantified SUVmax (where, not how much). The suitability score is heuristic, not validated. Co-registration is spatial and approximate (different dates, mm error). SUVmax suffers partial volume (underestimates foci < ~10 mm). What is publicly reproducible is the segmentation (TotalSegmentator) and the data schema; the DICOM re-quantification was an in-house measurement, flagged as such in every figure.
2 · The schema-manifest · a clonable contract
The data lives in a manifest with field-by-field provenance. Each figure is a cell with its schema; another case fills the same structure with THEIR data. The schema travels INSIDE the downloadable JSON (it is the contract, not a label painted on top).
Cell {
  valor    : number | string | null   // null = no aplica / no medido
  unidad   : 'SUVmáx' | 'mm' | 'ml' | 'HU' | '0-100' | ''
  fecha    : ISO del estudio de origen ('' = sin fecha)
  trazador : '18F-FDG' | '68Ga-DOTATOC' | ''
  fuente   : 'informe' | 'dicom-medicion-david' | 'rmn-literal'
           | 'derivado' | 'aproximado'
  ref      : // código de biopsia / nota (opcional)
  medido   : boolean   // true = MEDIDO (cantidad física) · false = INTERPRETADO
}
The JSON includes this schema plus the 19 foci. Anti-PHI: synthetic ids #1–19, no name or record number. It is the same source as the table above — what you see is what you download.
3 · Fork this · for another N-of-1 case
Clone the schema + the pipeline for your case: fill the same cell with YOUR studies (reports + DICOM), run the segmentation with TotalSegmentator, project your PET onto the mesh, and keep the principles. What you inherit is not a datum, it is a METHOD: describe and equip, do not conclude; field-by-field provenance; opt-in heuristic suitability. Without over-promising: the segmentation and the schema are publicly reproducible; the DICOM re-quantification will depend on your access to the native images.
4 · Honesty principles · they are part of the method
- Describe / equip, do not conclude. The page gathers the evidence so the team can choose its target; the formal reading and the decision are human.
- Measured vs interpreted. Every figure declares whether it is a measured physical quantity (SUVmax, mm, ml) or a reading/rule (morphology, phenotype, score). The manifest does not invent precision.
- Suitability is indicative, not validated. The score is heuristic (hand-set weights); offered as a lens, never imposed as a verdict or as the default order.
- Anti-PHI · synthetic ids. Only foci #1–19; no name, record number or patient metadata — not on the page, not in the URL, not in the export.